Validation v1: interpolated against measured depth
Prototype 1, methodology p1-0.1, protocol v1 (pre-registered 8 October 2026 in docs/03-science/prototype-1-planning.md §5). Generated by python -m aethon_p1 validate; published whatever it shows.
Question
Where depth was not measured, how far from measurement are the depths shown, and does that error grow with depth or with distance to the nearest measurement?
Result
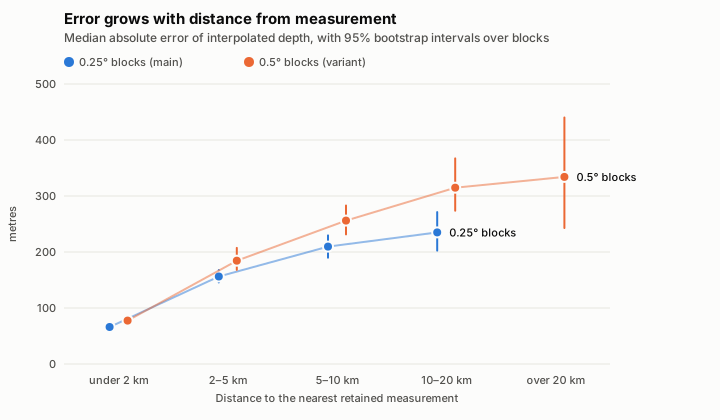
Holding out 112 of 560 well-mapped 0.25° blocks and predicting their 387,362 multibeam cells from measurements around them, the median absolute error was 147 m (95% interval 137–157 m), and 1 in 10 predictions was off by more than 476 m. The error rises at every step away from measurement, from 66 m within 2 km to 235 m at 10–20 km.
Decision (rule fixed before the run). Spearman ρ between distance bin and median absolute error is 1.00 (threshold 0.5). Median absolute error rises with distance to the nearest measurement (Spearman rho 1.00 > 0.5): Prototype 1 shows predicted-depth uncertainty as a function of distance to measurement, beside the measured curve.
Design
- Truth: GEBCO_2026 cells with type code 11 (multibeam), a 15″ grid, not raw soundings.
- Blocks: 0.25° (about 27 km); eligible when at least 80% of a block's cells are type 11 (560 of 1,344); 20% held out with seed 20261008. Variant: 0.5° blocks (117 eligible, 23 held out).
- Predictor A: each held-out block's type-11 cells predicted from measured cells (types 10–17) within 50 km outside the block, by linear interpolation on a Delaunay triangulation, in local kilometres. 636 cells in the main run fell outside the triangulation and could not be predicted.
- Predictor B: Not run: no independent predicted-depth grid is licence-cleared.
- Error = predicted − true depth; positive means predicted deeper. 95% intervals from 1,000 bootstrap resamples of blocks.
Results, main run (0.25° blocks)
| Cells | Median error, m (95% interval) | Median absolute error, m | 90th percentile absolute error, m | RMSE, m | |
|---|---|---|---|---|---|
| All | 387,362 | −2 (−16 to 11) | 147 (137 to 157) | 476 (443 to 517) | 297 (271 to 326) |
By distance to the nearest retained measurement
| Cells | Median error, m (95% interval) | Median absolute error, m | 90th percentile absolute error, m | RMSE, m | |
|---|---|---|---|---|---|
| under 2 km | 92,964 | −5 (−8 to −1) | 66 (62 to 70) | 235 (223 to 247) | 144 (136 to 151) |
| 2–5 km | 129,282 | −9 (−28 to 8) | 156 (146 to 168) | 446 (417 to 475) | 270 (255 to 287) |
| 5–10 km | 135,955 | 9 (−25 to 43) | 210 (190 to 230) | 571 (519 to 632) | 357 (320 to 399) |
| 10–20 km | 29,161 | 11 (−35 to 65) | 235 (202 to 271) | 704 (576 to 817) | 430 (363 to 505) |
| over 20 km | 0 | – | – | – | – |
By true depth
| Cells | Median error, m (95% interval) | Median absolute error, m | 90th percentile absolute error, m | RMSE, m | |
|---|---|---|---|---|---|
| under 2,000 m | 2,432 | 597 (333 to 1,189) | 597 (333 to 1,189) | 1,765 (686 to 2,208) | 989 (452 to 1,394) |
| 2,000–3,000 m | 68,694 | 118 (82 to 164) | 174 (150 to 206) | 591 (488 to 686) | 349 (302 to 399) |
| 3,000–4,000 m | 228,278 | 0 (−20 to 18) | 139 (128 to 152) | 442 (407 to 487) | 268 (244 to 298) |
| over 4,000 m | 87,958 | −82 (−116 to −52) | 144 (121 to 167) | 462 (406 to 512) | 281 (249 to 311) |
Results, variant (0.5° blocks)
| Cells | Median error, m (95% interval) | Median absolute error, m | 90th percentile absolute error, m | RMSE, m | |
|---|---|---|---|---|---|
| All | 318,171 | 7 (−37 to 54) | 230 (207 to 257) | 674 (598 to 752) | 407 (362 to 452) |
| under 2 km (variant) | 39,640 | −5 (−14 to 3) | 78 (71 to 85) | 274 (249 to 304) | 167 (152 to 183) |
| 2–5 km (variant) | 62,097 | −9 (−38 to 23) | 184 (168 to 207) | 523 (469 to 585) | 315 (286 to 345) |
| 5–10 km (variant) | 87,888 | 15 (−52 to 73) | 256 (231 to 283) | 674 (608 to 751) | 414 (376 to 452) |
| 10–20 km (variant) | 108,083 | 38 (−78 to 142) | 315 (274 to 367) | 779 (676 to 895) | 481 (419 to 542) |
| over 20 km (variant) | 20,463 | −14 (−186 to 169) | 334 (243 to 440) | 810 (672 to 1,014) | 511 (408 to 616) |
Spearman ρ over the variant's distance bins: 1.00. Over individual cells, ρ between distance and absolute error is 0.37 (main) and 0.33 (variant): distance explains the typical error, not each cell's error.
Reading the results (written after the run)
- Median absolute error rises at every step away from measurement, from 66 m to 235 m (3.6 times as large).
- Cells shallower than 2,000 m, mostly summits and ridge crests, come out too deep (median error 597 m over 2,432 cells): interpolation smooths high points away.
- Cells deeper than 4,000 m come out too shallow (median error −82 m): the same smoothing, in the deeps.
- The 0.5° variant's errors are larger than the main run's in every distance bin both have: wider gaps, larger errors, even at the same distance from the nearest measurement.
Limitations (stated in the protocol before the run)
- Truth is gridded multibeam, not raw soundings.
- Held-out blocks sit in densely mapped areas, so the test measures gaps of block size, not the open flanks; the main run reaches about 20 km from measurement at most.
- GEBCO's own gravity-guided prediction is not reproduced here; Predictor B would test that once a predicted grid is licence-cleared. The errors above are for interpolation between measurements.
- Rough axial-valley terrain may inflate errors compared with smoother flanks.
How Prototype 1 uses this
Where a hexagon's depth is not all measured, its profile gives the distance from the unmeasured part to the nearest measurement and the error this test found at that distance, with the measured case beside it. Beyond the distances tested it says the error there is untested. It never presents these numbers as GEBCO's own uncertainty.
Reproduce
cd research/prototype-1
uv run python -m aethon_p1 fetch
AETHON_P1_MODE=public uv run python -m aethon_p1 validate
Per-cell results: derived/public/validation_result.parquet (run ids v1-0.25deg and v1-0.5deg).